Free Stock Charts
Create free stock charts for leading global stocks.
Get BATS real-time prices with up to 10-years of chart data.
Zignals HTML5 charts can be used on all the latest browsers and OS systems.
Best Global HTML5 Stock Charts
Chart the world with our coverage of US, UK and European stocks.
Compare multiple charts or quickly cycle through stocks with our integrated watchlist.
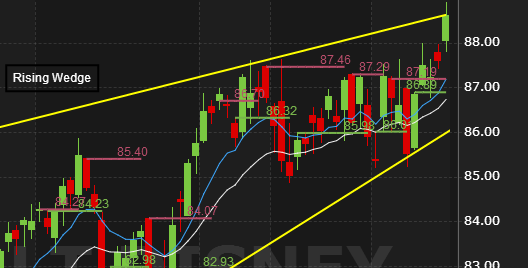
Over 25 Technical Indicators
Select from over 25 trend, momentum or volume indicators. Customize their look, from colour and opacity to thickness and style. Create Templates from your favourite indicators, apply them to your charts.
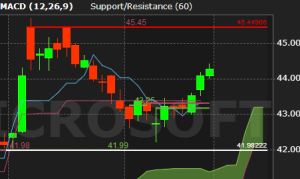
Try our new Ichimoku Cloud price overlay. Or instead take advantage of our Accelerator Indicator, Awesome Indicator, Pivot Points or newly adapted Support/Resistance lines.
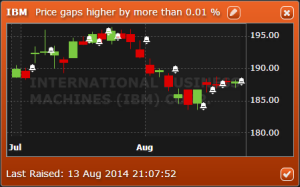
Build alerts directly from the chart. Track alert triggers, and see how alerts performed in the past; on a chart or tabulated for your convenience. Overlay multiple alerts on the one chart.
BATS Real-time Intraday Data
BATS real-time data powers our new HTML5 charts and integrated alerts. Create alerts to identify support and resistance breaks or gap moves, and follow up with a study of a chart.
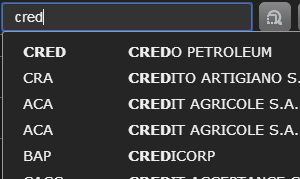
Stock lists support quick cycling between stocks. Create custom watchlists to follow your favourite stocks by country or sector.
Annotate and Save
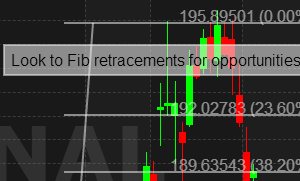
Comment on your charts, enhance with support and resistance, and pivot points. Highlight price areas of interest and mark horizontal price levels and vertical time markers.
Save your charts to embed into a blog, tumblr or post to Twitter and Facebook.
Share a chart via email.